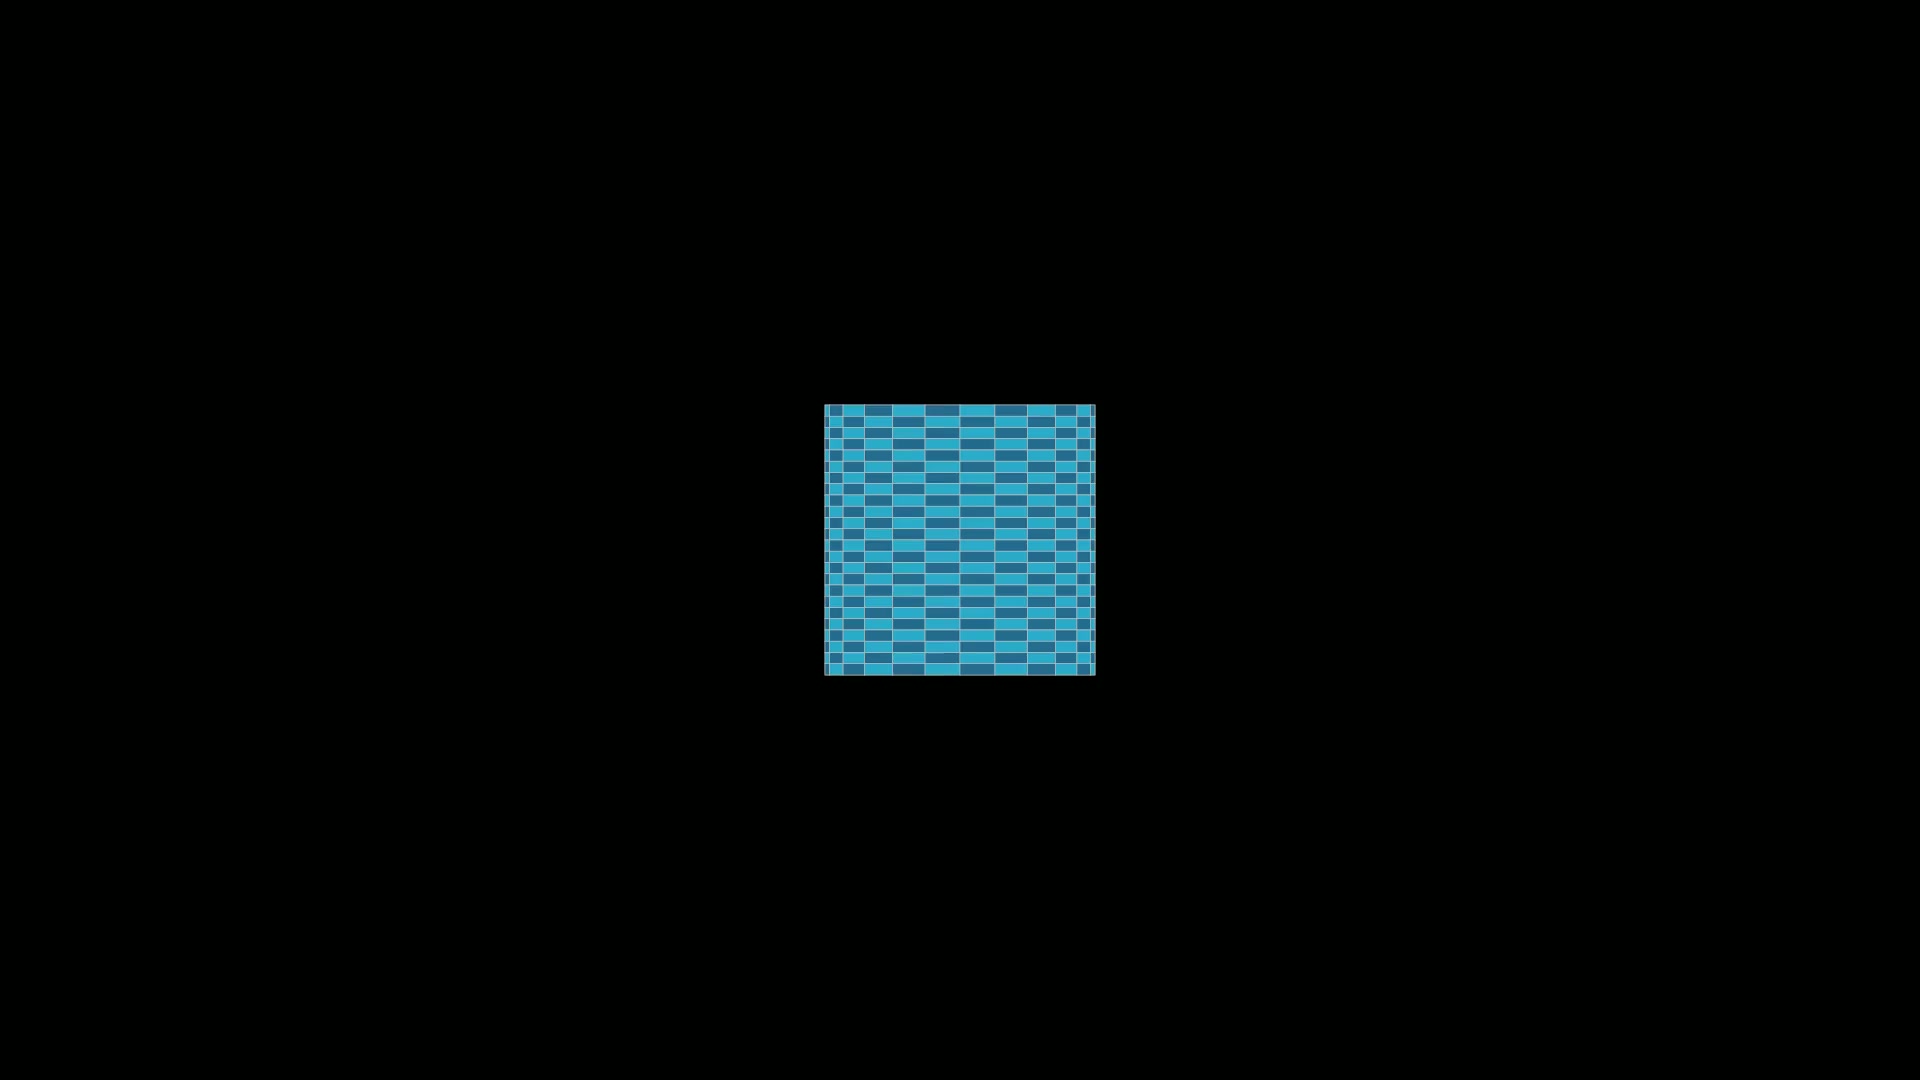
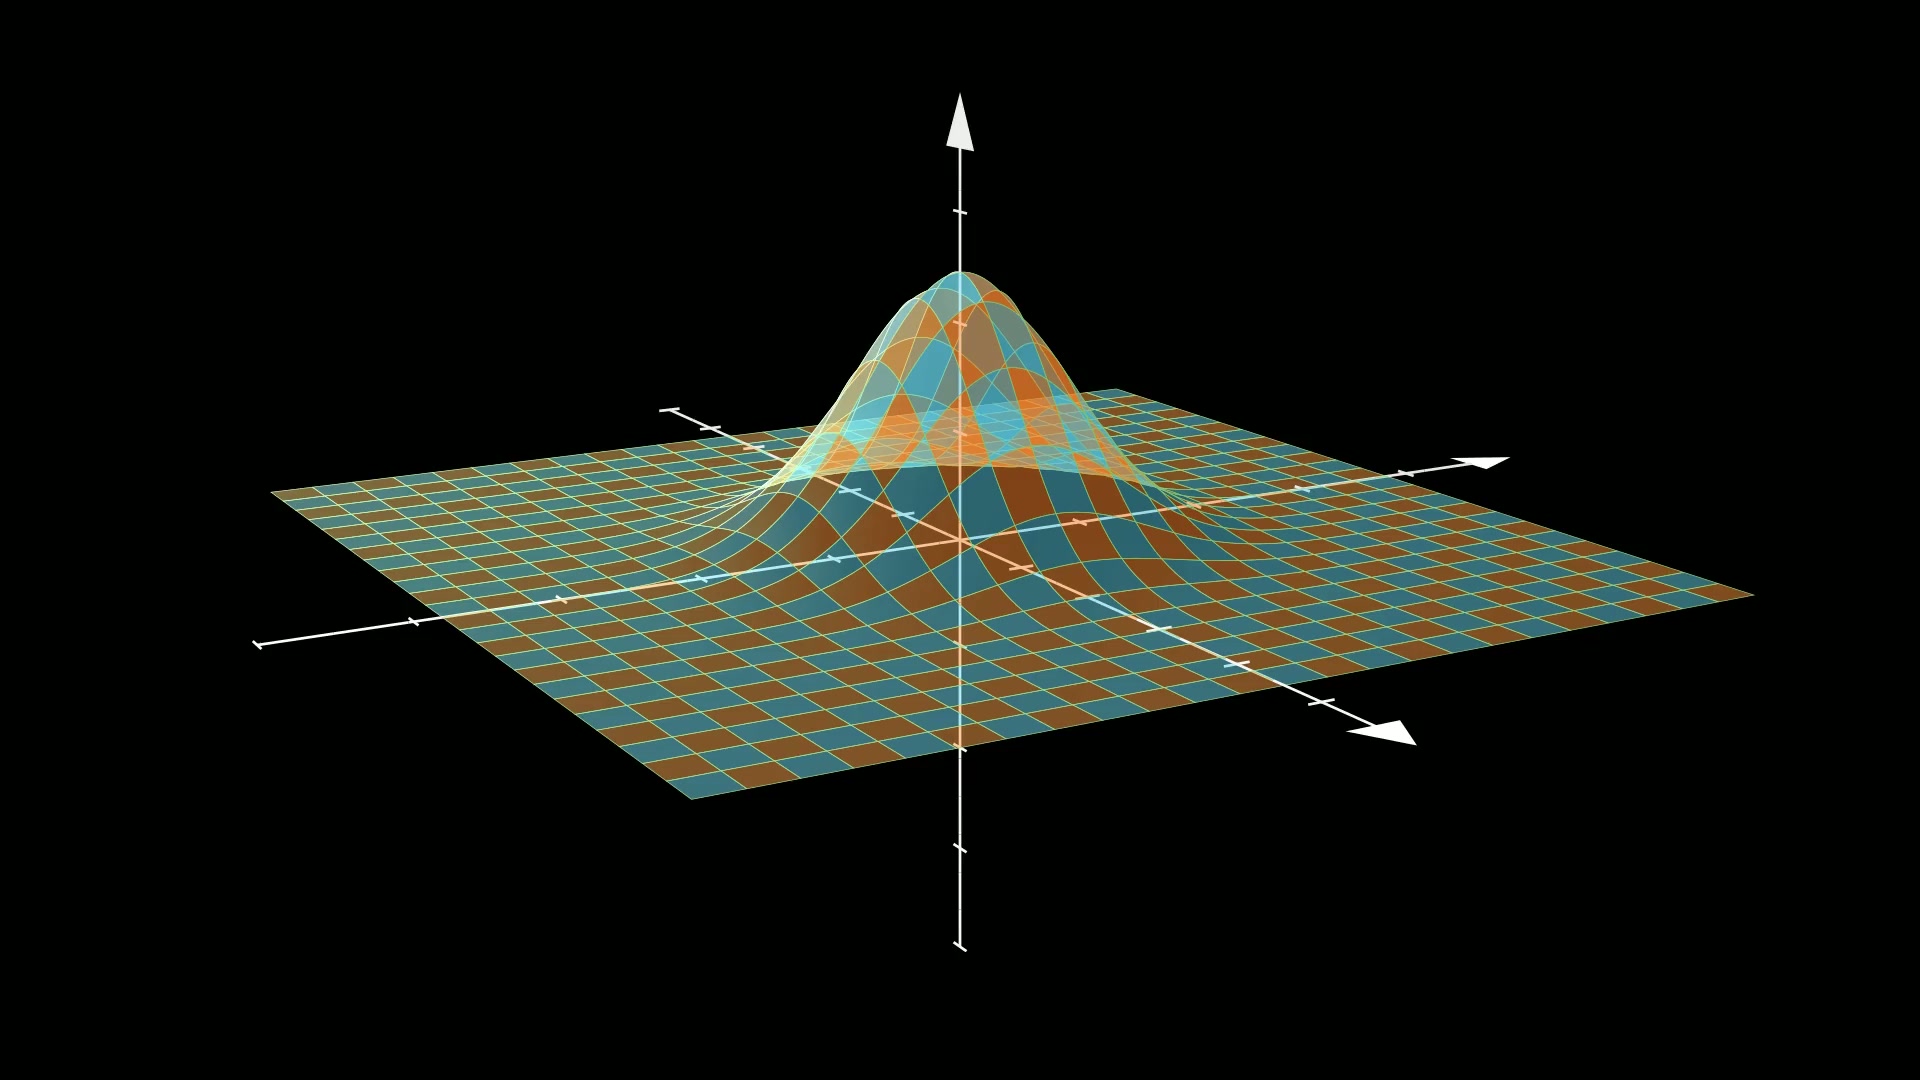
用参数方程画一个二维高斯曲面:Surface 接收 (u, v) -> [x, y, z] 的函数,示例在 [−2,2]2 上采样,缩放后用棋盘格填充,配合 ThreeDAxes 呈现高度起伏。
完整代码
1
2
3
4
5
6
7
8
9
10
11
12
13
14
15
16
17
18
19
20
21
22
23
24
25
26
| from manim import *
import numpy as np
class ThreeDSurfacePlot(ThreeDScene):
def construct(self):
resolution_fa = 24
self.set_camera_orientation(phi=75 * DEGREES, theta=-30 * DEGREES)
def param_gauss(u, v):
x = u
y = v
sigma, mu = 0.4, [0.0, 0.0]
d = np.linalg.norm(np.array([x - mu[0], y - mu[1]]))
z = np.exp(-(d ** 2 / (2.0 * sigma ** 2)))
return np.array([x, y, z])
gauss_plane = Surface(
param_gauss,
resolution=(resolution_fa, resolution_fa),
v_range=[-2, +2],
u_range=[-2, +2]
)
gauss_plane.scale(2, about_point=ORIGIN)
gauss_plane.set_style(fill_opacity=1,stroke_color=GREEN)
gauss_plane.set_fill_by_checkerboard(ORANGE, BLUE, opacity=0.5)
axes = ThreeDAxes()
self.play(*[FadeIn(_o) for _o in [axes, gauss_plane]], run_time=1.0)
self.wait(1)
self.wait(3.60)
|
演示视频
下载 Python 脚本
要点
Surface(func, u_range=..., v_range=...) 的函数必须返回三维点set_fill_by_checkerboard(c1, c2, opacity=...) 用双色棋盘格填充曲面set_style(fill_opacity=1, stroke_color=...) 统一设置填充与描边
代码来源:Manim Community 官方 Example Gallery 示例 ThreeDSurfacePlot(MIT),已在 Manim CE 0.20.1 实跑验证并生成上方视频。

主观感受,仅供参考。本文采用 本文采用 CC BY-NC-SA 4.0 许可 协议,
完整转载请注明来自
数学动画引擎。