Manim的Axes对象是通用的坐标系对象,之前几篇介绍的数轴和各种坐标平面都是继承Axes对象。
Axes对象的主要作用在于创建和管理二维坐标轴,以满足我们制作数学动画时的各种需求。
具体来说,Axes对象可以帮助我们:
- 定义坐标系:定义一个明确的坐标系,通过设置x轴和y轴的范围、步长等参数,创建符合自己需求的坐标轴
- 定制坐标轴样式:可以设置坐标轴的颜色、刻度线的长度、箭头的长度等属性,还可以控制是否显示刻度线、标签和注释等
- 绘制函数曲线:绘制各种自定义的函数曲线,如二次函数、三角函数、指数函数等
- 添加图形和标签:可以添加图形元素(如圆、三角形等)和标签(如坐标轴标签、标题等)
1. 主要参数
Axes的主要参数有:
| 参数名称 |
类型 |
说明 |
| x_range |
Sequence[float] |
横坐标轴范围,间隔 |
| y_range |
Sequence[float] |
纵坐标轴范围,间隔 |
| x_length |
float |
横轴的宽度 |
| y_length |
float |
纵轴的高度 |
| axis_config |
dict |
坐标轴的通用配置选项 |
| x_axis_config |
dict |
横轴的配置选项 |
| y_axis_config |
dict |
纵轴的配置选项 |
| tips |
bool |
横轴的右边和纵轴上边是否显示箭头 |
参数axis_config和x_axis_config,y_axis_config中的可配置的项目类似,
区别在于axis_config是针对整个坐标轴的配置,
x_axis_config和y_axis_config是分别针对横轴和纵轴的配置。
如果它们设置了相同的项,那么x_axis_config和y_axis_config中的设置会覆盖axis_config中相应的设置。
可对坐标轴设置的项有很多,下面列举了一些常用的。
stroke_color:设置坐标轴线的颜色stroke_width(或line_width):设置坐标轴线的宽度include_numbers:是否在坐标轴上显示数字numbers_to_include:指定要显示数字的列表。numbers_with_elongated_ticks:指定要加长刻度线的数字列表。用于突出显示特定的刻度include_ticks:是否显示刻度线tick_size:设置刻度线的长度include_tip:是否在坐标轴的末端显示箭头tip_length:设置箭头的长度。当include_tip为True时,此选项才有效font_size:设置坐标轴上数字的字体大小label_direction:设置坐标轴标签的方向scaling:设置坐标轴的刻度缩放方式,如线性刻度、对数刻度等
2. 主要方法
Axes的方法主要是为了动态获取坐标轴上的各种信息,以及在坐标轴上绘制函数图形。
其中用的比较多的有:
| 名称 |
说明 |
| coords_to_point |
将坐标转换为在屏幕上点的位置 |
| point_to_coords |
将屏幕上点的位置转换为坐标 |
| get_axes |
获取各个坐标轴的信息 |
| plot_line_graph |
在坐标轴中绘制函数图形 |
3. 使用示例
下面通过由简单到复杂的示例,一步步演示如何使用Axes对象。
3.1. 基本坐标系
使用Axes对象创建一个基本的二维坐标系,设置x轴和y轴的范围,并显示坐标轴上的数字和刻度线。
下面的示例设置x轴范围[-5,5],y轴范围[-3,3],坐标轴上以1为间隔显示数字和刻度线。
1
2
3
4
5
6
7
8
9
10
11
12
13
| from manim import *
import numpy as np
from numpy import array, pi, cos, sin
run_time = 1
data = [[1, 2], [3, 4]]
def dot(pos, **kwargs):
return Dot(pos, **kwargs)
class Z0096(Scene):
def construct(self):
sc = self
self.play(*[FadeIn(_o) for _o in [Axes(x_range=[-5, 5, 1], y_range=[-3, 3, 1], axis_config={'include_numbers': True})]], run_time=1.0)
self.wait(0.5)
self.wait(4.10)
|
下载 Python 脚本
3.2. 自定义坐标轴样式
自定义坐标轴的样式,包括轴的颜色、线条宽度、刻度线的长度和是否显示箭头等。
下面的示例将x轴设置为红色,线条宽度为2;y轴设置为蓝色,线条宽度为1.5,且x轴和y轴末端均显示不同的箭头。
1
2
3
4
5
6
7
8
9
10
11
12
13
14
15
| from manim import *
import numpy as np
from numpy import array, pi, cos, sin
run_time = 1
data = [[1, 2], [3, 4]]
def dot(pos, **kwargs):
return Dot(pos, **kwargs)
class Z0097(Scene):
def construct(self):
sc = self
axes = Axes(x_range=[-5, 5, 1], y_range=[-3, 3, 1], x_axis_config={'color': RED, 'stroke_width': 5, 'include_tip': True, 'tip_shape': ArrowSquareTip}, y_axis_config={'color': BLUE, 'stroke_width': 1.5, 'include_tip': True, 'tip_shape': StealthTip}, axis_config={'numbers_with_elongated_ticks': [0, -3, 3], 'font_size': 20})
self.play(FadeIn(axes), run_time=1.0)
self.wait(1)
self.wait(0.5)
self.wait(3.10)
|
下载 Python 脚本
3.3. 绘制函数曲线
坐标系上绘制一个函数曲线。
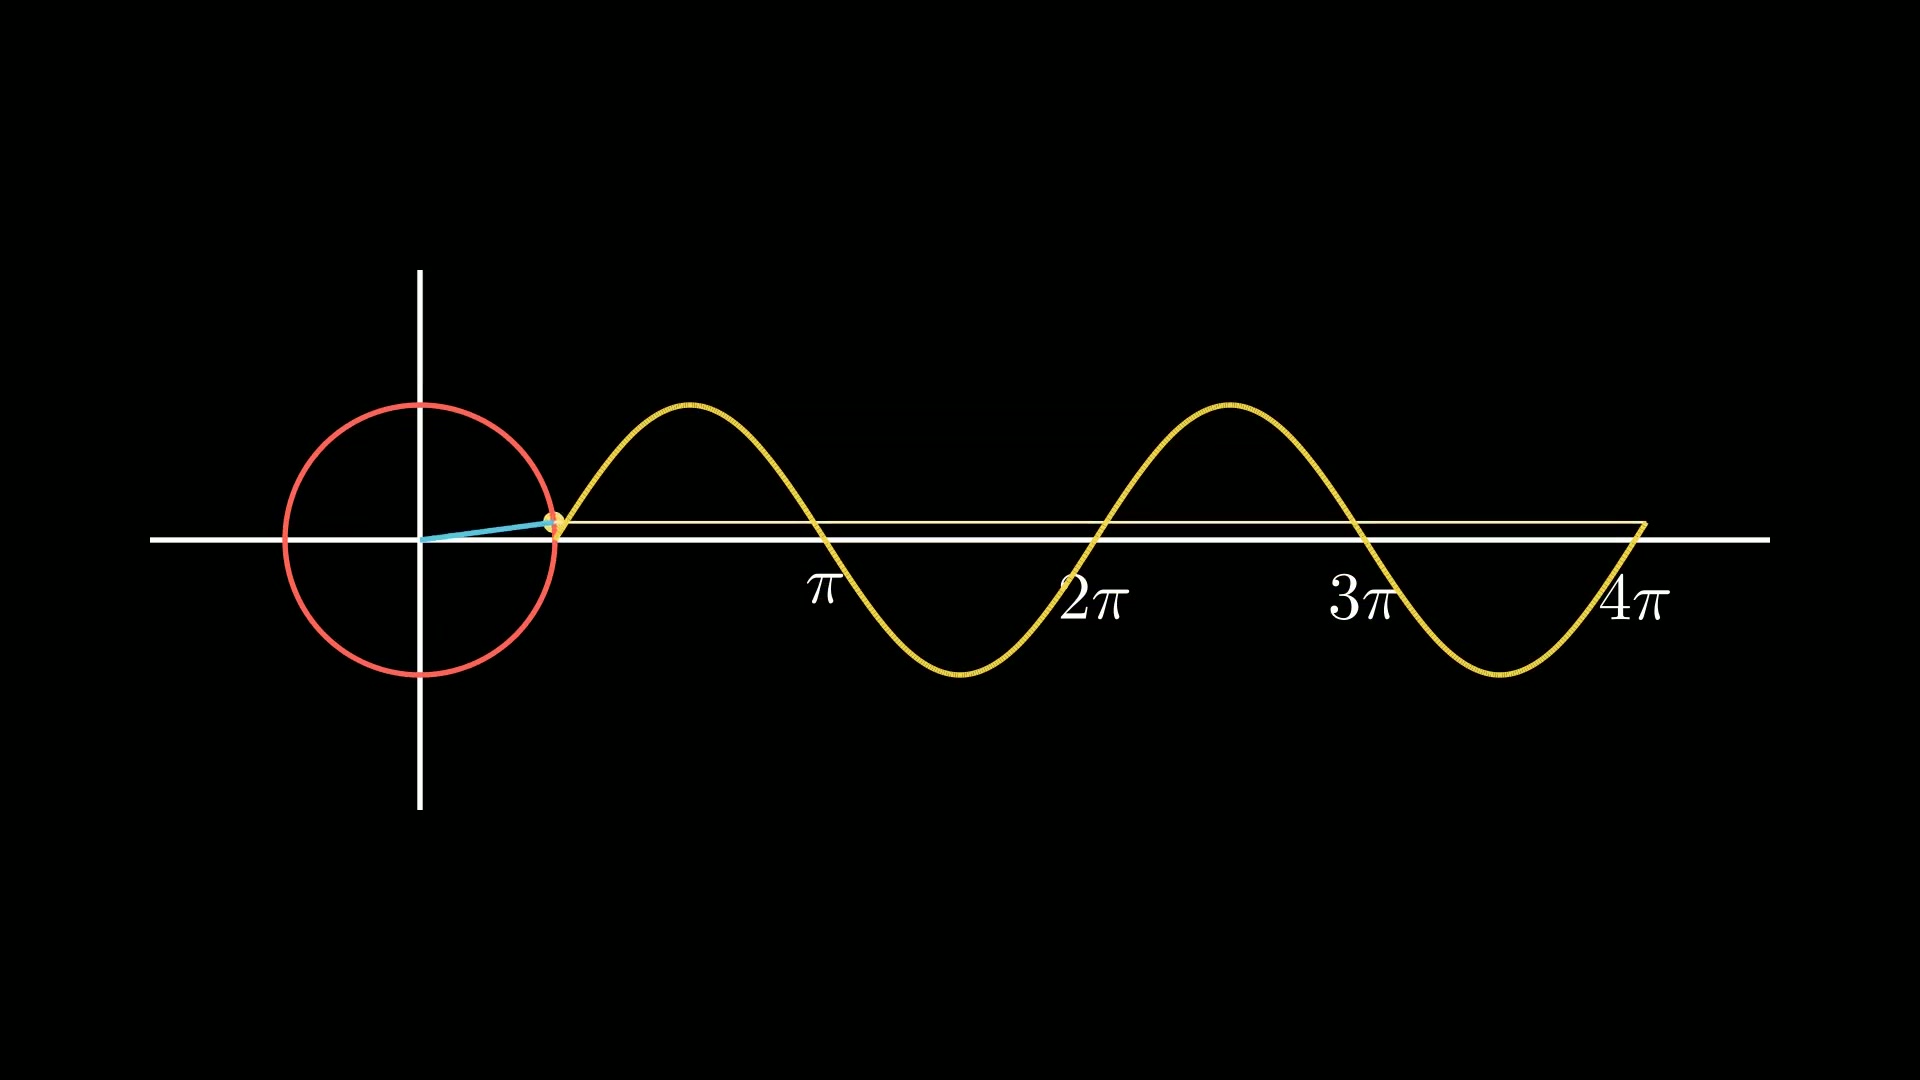
比如,下面的示例绘制一个抛物线(y=x2)和一个三角函数曲线(y=sin(θ))。
1
2
3
4
5
6
7
8
9
10
11
12
13
14
15
16
17
18
19
| from manim import *
import numpy as np
from numpy import array, pi, cos, sin
run_time = 1
data = [[1, 2], [3, 4]]
def dot(pos, **kwargs):
return Dot(pos, **kwargs)
class Z0098(Scene):
def construct(self):
sc = self
axes = Axes(x_range=[-5, 5, 1], y_range=[-5, 5, 1], x_axis_config={'color': RED}, y_axis_config={'color': BLUE}, axis_config={'include_numbers': True, 'font_size': 20, 'include_tip': True, 'tip_shape': StealthTip, 'tip_length': 2})
func = lambda x: x ** 2
graph = axes.plot(func, x_range=[-2, 2], color=GREEN)
self.play(Create(graph), run_time=run_time)
func = lambda x: np.sin(x)
graph = axes.plot(func, x_range=[-5, 5], color=YELLOW)
self.play(Create(graph), run_time=run_time)
self.wait(0.5)
self.wait(3.10)
|
下载 Python 脚本
3.4. 添加标签和注释
在坐标轴上添加标签,并在函数曲线上添加注释,以解释图形的含义。
下面的示例基于上一节的函数曲线,标出坐标轴名称x和y,并且选择抛物线上的一个点,标出点的坐标。
1
2
3
4
5
6
7
8
9
10
11
12
13
14
15
16
17
18
19
20
21
22
23
24
25
26
27
28
29
30
31
32
33
34
35
| from manim import *
class Demo(Scene):
def construct(self):
axes = Axes(
x_range=[-5, 5, 1],
y_range=[-5, 5, 1],
x_axis_config={
"color": RED,
},
y_axis_config={
"color": BLUE,
},
axis_config={
"include_numbers": True,
"font_size": 20,
"include_tip": True,
"tip_shape": StealthTip,
"tip_length": 2,
},
)
func = lambda x: x**2
graph = axes.plot(func, x_range=[-2, 2], color=GREEN, stroke_width=2)
x_label = axes.get_x_axis_label(
MathTex("x", font_size=25, color=RED),
direction=UP,
)
y_label = axes.get_y_axis_label(
MathTex("y", font_size=25, color=BLUE),
direction=RIGHT,
)
x = 1.5
_obj = axes
self.play(FadeIn(_obj), run_time=1.0)
self.wait(3.00)
self.wait(1.60)
|
下载 Python 脚本
4. 附件

主观感受,仅供参考。本文采用 本文采用 CC BY-NC-SA 4.0 许可 协议,
完整转载请注明来自
数学动画引擎。