使用Manim难免会遇到渲染函数图像的问题,特别是初中数学使用Manim制作课件,今天我们就来简单的总结一下,使用Manim制作分段函数的图像该如何制实现这个过程,做一个记录分析,主要是帮助自己记住一些简单的知识,高手滑过。
1.画一个分段函数
我们先来制作一个分段函数的图像,来看下面的代码
1
2
3
4
5
6
7
8
9
10
11
12
13
14
15
16
17
18
19
20
21
22
23
24
25
26
27
28
29
30
31
32
33
34
35
36
37
38
39
40
41
42
43
44
45
46
47
48
49
50
51
52
53
54
55
56
57
58
59
60
61
62
63
64
65
66
67
68
69
70
71
72
73
74
75
76
77
78
79
| from manim import *
import numpy as np
class PiecewiseFunctionPlot(Scene):
def construct(self):
axes = Axes(
x_range=[-3.5, 3.5, 1],
y_range=[-1.5, 3.5, 1],
axis_config={"color": BLUE},
x_length=7,
y_length=5,
)
axes_labels = axes.get_axis_labels(x_label="x", y_label="y")
def piecewise_func(x):
if x < 0:
return x**2
elif x == 0:
return 1
else:
return 2*x + 1
graph1 = axes.plot(lambda x: x**2, x_range=[-1.5, 0], color=RED)
dot_open = Dot(axes.c2p(0, 0), color=RED, radius=0.08)
dot_open.set_fill(opacity=0)
graph2 = axes.plot(lambda x: 2*x + 1, x_range=[0, 1], color=GREEN)
dot_closed = Dot(axes.c2p(0, 1), color=GREEN, radius=0.08)
special_point = Dot(axes.c2p(0, 1), color=YELLOW, radius=0.1)
func_label1 = MathTex("f(x) = x^2,\\ x < 0", color=RED).scale(0.8)
func_label1.next_to(axes.c2p(-2, 2.25), LEFT,buff=0.5)
func_label2 = MathTex("f(x) = 2x + 1,\\ x > 0", color=GREEN).scale(0.8)
func_label2.next_to(axes.c2p(1, 3), RIGHT)
special_label = MathTex("f(0) = 1", color=YELLOW).scale(0.8)
special_label.next_to(axes.c2p(0, 1), UP)
self.play(Create(axes), Write(axes_labels))
self.wait(0.5)
self.play(Create(graph1), run_time=2)
self.play(FadeIn(dot_open))
self.play(Write(func_label1))
self.wait(0.5)
self.play(FadeIn(special_point))
self.play(Write(special_label))
self.wait(0.5)
self.play(Create(graph2), run_time=2)
self.play(FadeIn(dot_closed))
self.play(Write(func_label2))
self.wait(1)
title = Text("分段函数示例", font_size=36, color=WHITE)
title.to_edge(UP)
self.play(Write(title))
self.wait(2)
|
2.分析坐标系
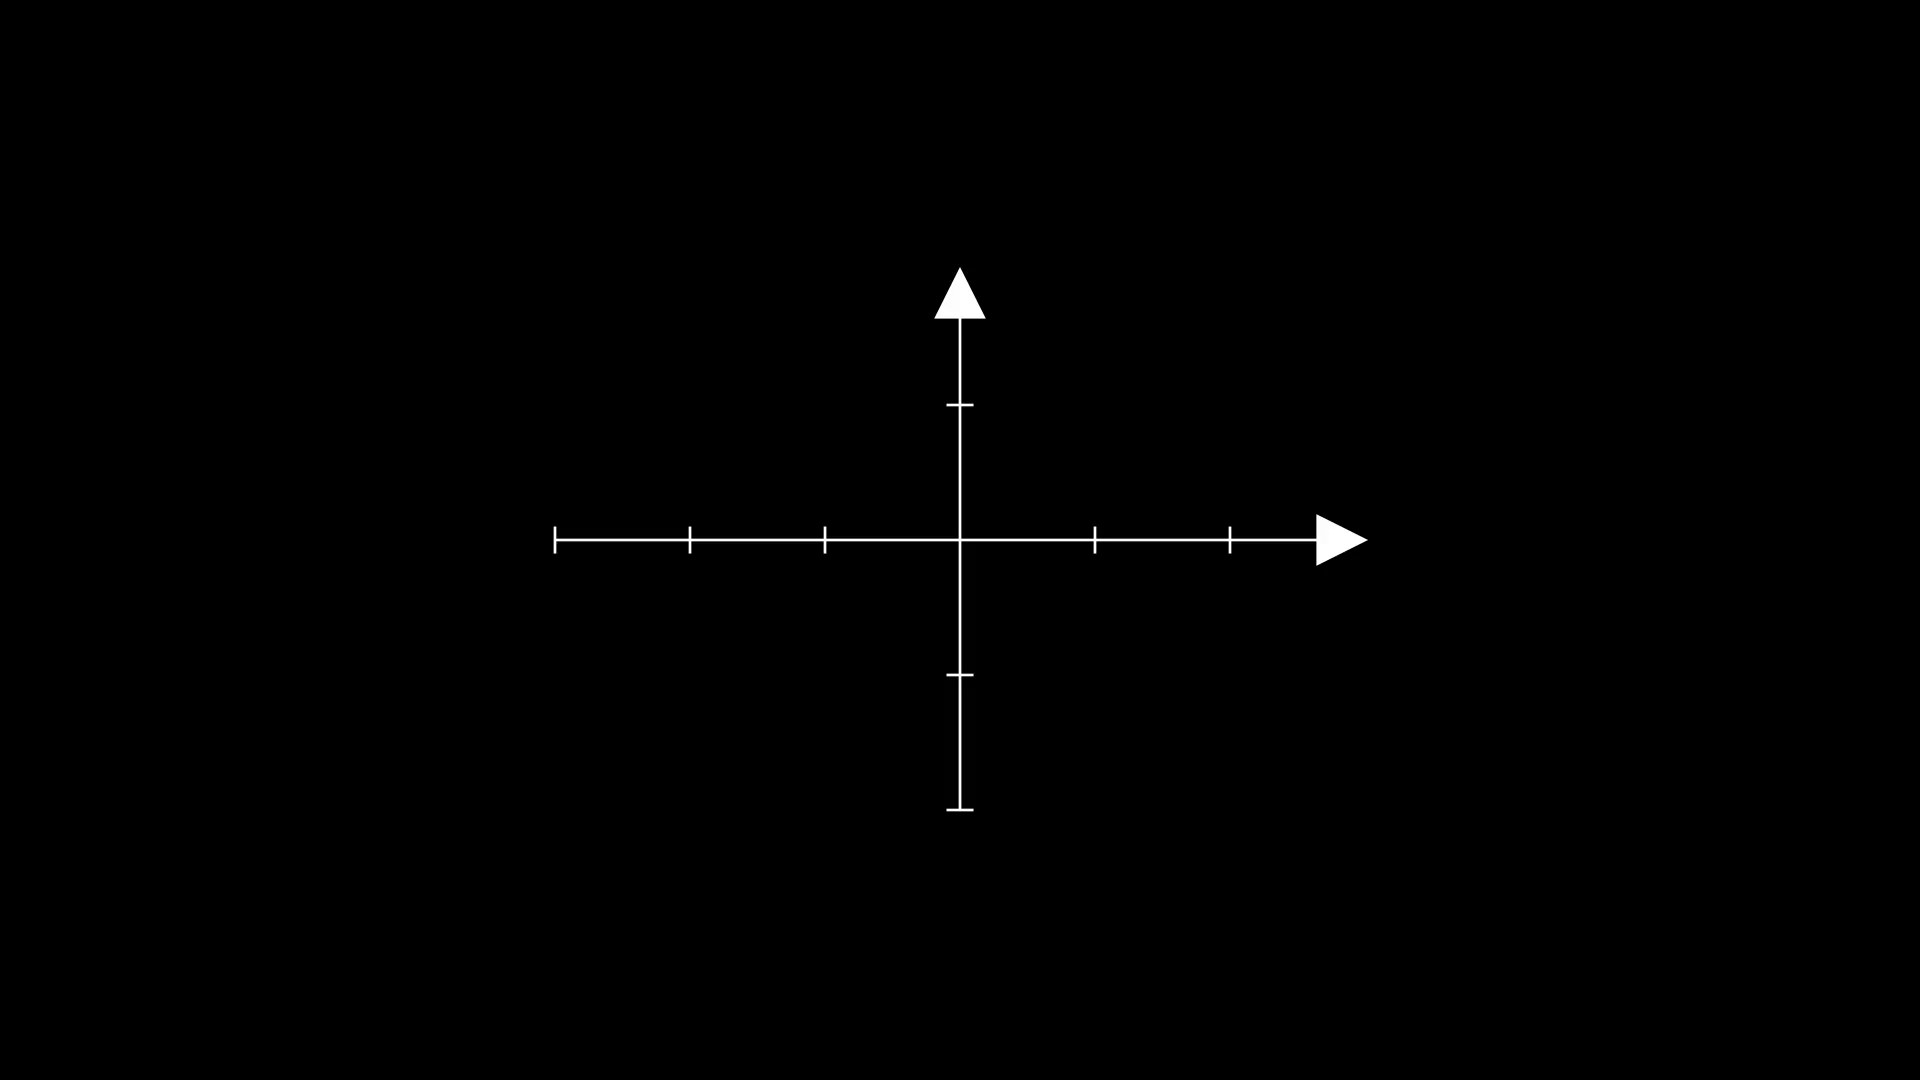
Manim渲染坐标系最容易遇到的问题,就是坐标轴的单位长度不一致,为了避免这个问题,我们分别调整了两个参数
1
2
3
4
5
6
7
8
9
10
11
|
axes = Axes(
x_range=[-3.5, 3.5, 1],
y_range=[-1.5, 3.5, 1],
axis_config={"color": BLUE},
x_length=7,
y_length=5,
)
axes_labels = axes.get_axis_labels(x_label="x", y_label="y")
|
注意看这里
这两个参数的数值不是凭空产生的,依据是
这样一来,7➗️7=5➗️5,就保持了单位长度的一致。详细的分析如下
1
2
3
4
5
6
7
| axes = Axes(
x_range=[-3.5, 3.5, 1],
y_range=[-1.5, 3.5, 1],
x_length=7,
y_length=5,
tips=False,
)
|
3.定义函数
Manim的函数定义有个特殊点儿,需要注意这个地方。先来看代码
1
2
3
4
5
6
7
8
9
10
11
|
def piecewise_func(x):
if x < 0:
return x**2
elif x == 0:
return 1
else:
return 2*x + 1
|
piecewise_func(x)仅仅是随意的一个自变量定义名,没有任何的特殊含义,但是指定了自变量是 x,
1
2
3
4
5
6
| if 条件:
return 结果
elif 另一个条件:
return 另一个结果
else 剩余的条件:
return 剩余的结果
|
Python变成之中没有 else if,只有 elif,很多有编程基础的朋友会犯这个错误。
4.函数图像绘制
我们仔细观察代码之中函数图像的绘制,会发现如下代码
1
| graph = axes.plot(lambda x: x**2, x_range=[-1.5, 0], color=RED)
|
graph并没有特殊的含义,英语之中就是分段的意思。其中绘制函数图像最终的函数,就是 **axes.plot()**函数,我们来看相关参数
1
2
3
4
5
| axes.plot(
function,
x_range,
**kwargs
)
|
其他的样式参数不限于
1
2
3
4
5
6
7
8
9
10
11
12
|
color=RED,
stroke_width=3,
stroke_opacity=0.8,
use_smoothing=True,
discontinuities=[],
dt=0.01,
use_vectorized=True,
|
5.坐标转换
发现一个小小的惊喜,就是笛卡尔坐标转换的问题
他可以直接把屏幕坐标转换成当前屏幕中设定的坐标系坐标。
1
| func_label1.next_to(axes.c2p(-2, 2.25), LEFT,buff=0.5)
|
也就是我们输入的坐标,就是当前坐标系的坐标。这为其他对象提供了准确的参照物。
6.坐标系平移
添加的坐标系默认原点中心在屏幕中心,如果需要将坐标系平移,我们可以修改坐标系代码
1
2
3
4
5
6
7
8
|
axes = Axes(
x_range=[-3.5, 3.5, 1],
y_range=[-1.5, 3.5, 1],
axis_config={"color": BLUE},
x_length=7,
y_length=5,
)
|
将上面的坐标系添加 shift
1
2
3
4
5
6
7
8
|
axes = Axes(
x_range=[-3.5, 3.5, 1],
y_range=[-1.5, 3.5, 1],
axis_config={"color": BLUE},
x_length=7,
y_length=5,
).shift(Up*2)
|
大家注意平移的真是距离,需要适当的调整。另外记录shift的用法
1
2
3
4
5
6
7
8
|
axes = Axes(
x_range=[-3.5, 3.5, 1],
y_range=[-1.5, 3.5, 1],
axis_config={"color": BLUE},
x_length=7,
y_length=5,
).shift(RIGHT * 2 + UP * 1)
|
好了,今天的学习就到这里。来看最终的代码展示效果

主观感受,仅供参考。本文采用 本文采用 CC BY-NC-SA 4.0 许可 协议,
完整转载请注明来自
数学动画引擎。