表格是一种常见的数据展示形式,manim提供了Table模块专门用于显示表格形式的数据。表格Table和上一节介绍的矩阵Matrix都是用来显示二维数据的,不过,Table的表现力更强,比如,它可以显示表头信息,列名信息等等。
Table模块也细分了多个对象:
- 通用
Table:显示任何内容
DecimalTable:表格内容为数字IntegerTable:表格内容为整数MathTable:表格内容是公式MobjectTable:表格内容是图形
其中,DecimalTable,IntegerTable,MathTable和MobjectTable都是继承自Table的。 本篇重点介绍Table对象,其他对象是Table的一个特例。
1. 主要参数
主要参数包括:
| 参数名称 |
类型 |
说明 |
| table |
list[list] |
表格中显示的数据 |
| row_labels |
list[VMobject] |
行标签,相当于表格的第一列 |
| col_labels |
list[VMobject] |
列标签,相当于列名,表格的第一行 |
| top_left_entry |
VMobject |
表格左上角显示的内容 |
| v_buff |
float |
表格元素行间距 |
| h_buff |
float |
表格元素列间距 |
| include_outer_lines |
bool |
是否显示表格外边框 |
| add_background_rectangles_to_entries |
bool |
表格背景色是否加到表格元素上 |
| entries_background_color |
manim color |
表格元素的背景色 |
| include_background_rectangle |
bool |
是否添加表格背景色 |
| background_rectangle_color |
manim color |
表格的背景色 |
| arrange_in_grid_config |
dict |
表格对齐方向的配置 |
| line_config |
dict |
表格线条的配置 |
总的来看,参数主要用于设置表格行列,表格背景,线条等相关的样式。
2. 主要方法
参数一般是初始化表格时使用,而方法则是用来动态的改变表格的内容和样式。 下面罗列了一些常用的方法:
| 名称 |
说明 |
| add_background_to_entries |
给表格元素添加背景 |
| add_highlighted_cell |
高亮某个单元格 |
| get_rows |
获取所有行对象 |
| get_columns |
获取所有列对象 |
| get_cell |
获取单元格 |
| get_row_labels |
获取行的标签 |
| get_col_labels |
获取列的标签 |
| get_horizontal_lines |
获取表格的横线 |
| get_vertical_lines |
获取表格的纵线 |
| scale |
缩放表格 |
| set_row_colors |
设置行颜色 |
| set_column_colors |
设置列颜色 |
| get_highlighted_cell |
获取高亮的单元格 |
3. 使用示例
下面通过示例演示常用的参数和方法。
3.1. 行列标签
表格Table是默认像矩阵Matrix一样,只显示数据,不过,与之不同的是, 表格可以通过属性rows_labels和col_labels添加行列信息的说明。
1
2
3
4
5
6
7
8
9
10
11
12
13
14
15
16
17
18
19
20
21
22
23
24
25
| from manim import *
import numpy as np
from numpy import array
run_time = 1
def dot(pos, **kwargs):
return Dot(pos, **kwargs)
data = [
["90", "100", "60"],
["66", "78", "83"],
]
cols = [Text("小红"), Text("小华"), Text("小明")]
rows = [Text("语文"), Text("数学")]
class T041_01(Scene):
def construct(self):
sc = self
data = [['90', '100', '60'], ['66', '78', '83']]
cols = [Text('小红'), Text('小华'), Text('小明')]
rows = [Text('语文'), Text('数学')]
objs = [Table(data), Table(data, col_labels=cols, row_labels=rows)]
g = VGroup(*objs).arrange(DOWN, buff=0.5)
if g.width > 12: g.scale(12.0 / g.width)
self.play(*[FadeIn(_o) for _o in [g]], run_time=1.0)
self.play(FadeIn(g))
self.wait(0.5)
self.wait(3.10)
|
下载 Python 脚本
其中列的标签就是学生姓名,行的标签是科目名称。
3.2. 内容对齐方向
表格中的内容默认是居中对齐的,可以通过参数arrange_in_grid_config来调整其对齐方向。
1
2
3
4
5
6
7
8
9
10
11
12
13
14
15
16
17
18
19
20
21
22
23
| from manim import *
import numpy as np
from numpy import array
run_time = 1
def dot(pos, **kwargs):
return Dot(pos, **kwargs)
data = [
["90", "100", "60"],
["66", "78", "83"],
]
cols = [Text("小红"), Text("小华"), Text("小明")]
rows = [Text("语文"), Text("数学")]
class T041_02(Scene):
def construct(self):
sc = self
t = Table(data, arrange_in_grid_config={'cell_alignment': RIGHT})
objs = [Table(data, arrange_in_grid_config={'cell_alignment': LEFT}), t]
g = VGroup(*objs).arrange(DOWN, buff=0.5)
if g.width > 12: g.scale(12.0 / g.width)
self.play(*[FadeIn(_o) for _o in [g]], run_time=1.0)
self.play(FadeIn(g))
self.wait(0.5)
self.wait(3.10)
|
下载 Python 脚本
3.3. 表格边框
默认表格是没有外边框的,通过include_outer_lines参数加上外边框,此外,line_config参数还可以设置边框的粗细和颜色。
1
2
3
4
5
6
7
8
9
10
11
12
13
14
15
16
17
18
19
20
21
22
| from manim import *
import numpy as np
from numpy import array
run_time = 1
def dot(pos, **kwargs):
return Dot(pos, **kwargs)
data = [
["90", "100", "60"],
["66", "78", "83"],
]
cols = [Text("小红"), Text("小华"), Text("小明")]
rows = [Text("语文"), Text("数学")]
class T041_03(Scene):
def construct(self):
sc = self
objs = [Table(data, include_outer_lines=True), Table(data, include_outer_lines=True, line_config={'stroke_width': 1, 'color': GREEN})]
g = VGroup(*objs).arrange(DOWN, buff=0.5)
if g.width > 12: g.scale(12.0 / g.width)
self.play(*[FadeIn(_o) for _o in [g]], run_time=1.0)
self.play(FadeIn(g))
self.wait(0.5)
self.wait(3.10)
|
下载 Python 脚本
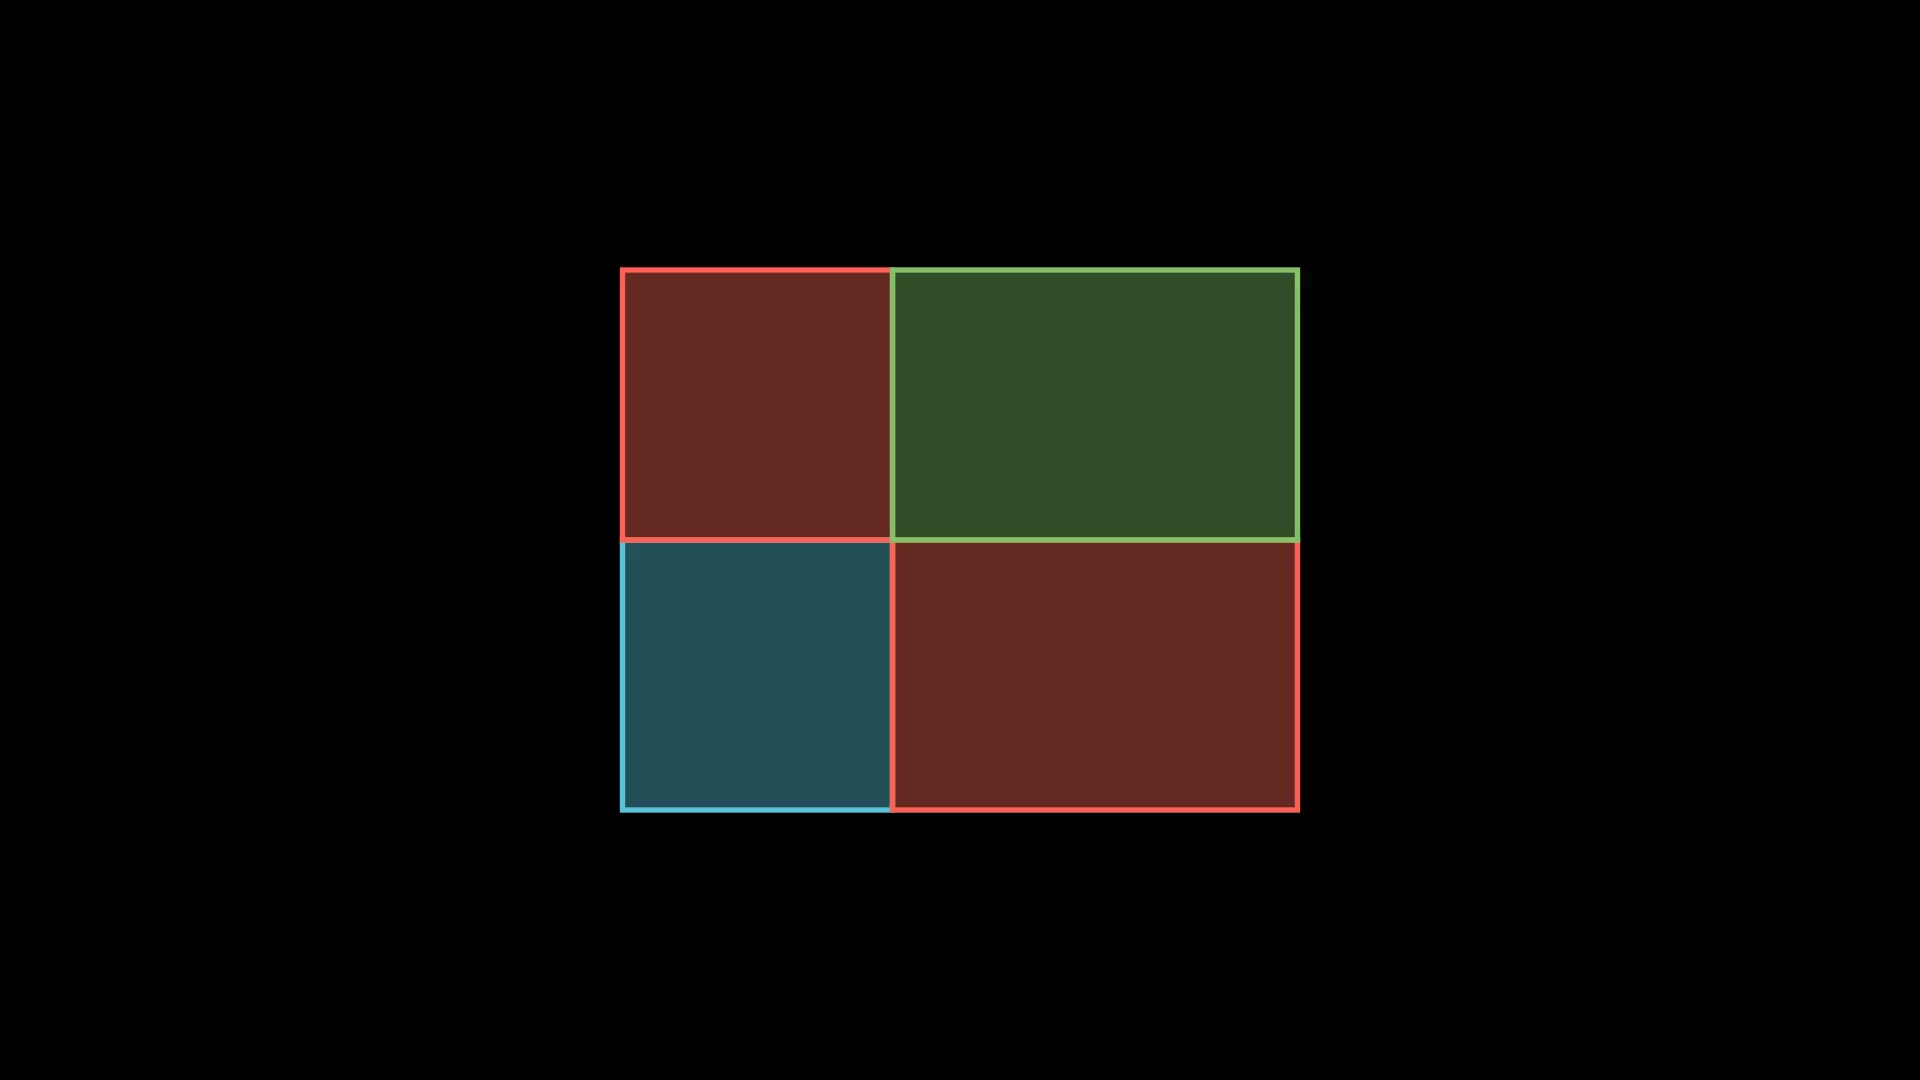
3.4. 表格背景
表格的背景默认是透明的,有两个参数add_background_rectangles_to_entries和include_background_rectangle, 可以分别设置表格元素的背景和整个表格的背景。
1
2
3
4
5
6
7
8
9
10
11
12
13
14
15
16
17
18
19
20
21
22
| from manim import *
import numpy as np
from numpy import array
run_time = 1
def dot(pos, **kwargs):
return Dot(pos, **kwargs)
data = [
["90", "100", "60"],
["66", "78", "83"],
]
cols = [Text("小红"), Text("小华"), Text("小明")]
rows = [Text("语文"), Text("数学")]
class T041_04(Scene):
def construct(self):
sc = self
objs = [Table(data, add_background_rectangles_to_entries=True), Table(data, include_background_rectangle=True)]
g = VGroup(*objs).arrange(DOWN, buff=0.5)
if g.width > 12: g.scale(12.0 / g.width)
self.play(*[FadeIn(_o) for _o in [g]], run_time=1.0)
self.play(FadeIn(g))
self.wait(0.5)
self.wait(3.10)
|
下载 Python 脚本
3.5. 定制左上角元素
表格在设置了行列名称之后,就会多出一个左上角位置,这个位置默认是空的。可以在表格的左上角填充任意的内容,包括数学公式和图形。
1
2
3
4
5
6
7
8
9
10
11
12
13
14
15
16
17
18
19
20
21
22
23
24
25
26
27
| from manim import *
import numpy as np
from numpy import array
run_time = 1
def dot(pos, **kwargs):
return Dot(pos, **kwargs)
data = [
["90", "100", "60"],
["66", "78", "83"],
]
cols = [Text("小红"), Text("小华"), Text("小明")]
rows = [Text("语文"), Text("数学")]
class T041_05(Scene):
def construct(self):
sc = self
cols = [Text('小红'), Text('小华'), Text('小明')]
rows = [Text('语文'), Text('数学')]
mt = MathTex('y=\\sum x_i', color=RED)
t = Table(data, row_labels=rows, col_labels=cols, top_left_entry=mt)
star = Star(color=RED).scale(0.5)
objs = [Table(data, row_labels=rows, col_labels=cols), mt, t, Table(data, row_labels=rows, col_labels=cols, top_left_entry=star)]
g = VGroup(*objs).arrange(DOWN, buff=0.5)
if g.width > 12: g.scale(12.0 / g.width)
self.play(*[FadeIn(_o) for _o in [g]], run_time=1.0)
self.play(FadeIn(g))
self.wait(0.5)
self.wait(3.10)
|
下载 Python 脚本
3.6. 行列操作
通过行列操作方法,可以获取行列对象,添加更多定制化的操作。
1
2
3
4
5
6
7
8
9
10
11
12
13
14
15
16
17
18
19
20
21
22
23
24
25
26
| from manim import *
class T041_06(Scene):
def construct(self):
data = [["90", "100", "60"], ["66", "78", "83"]]
cols = [Text("小红"), Text("小华"), Text("小明")]
rows = [Text("语文"), Text("数学")]
t1 = Table(data, row_labels=rows, col_labels=cols)
t1.set_row_colors(BLUE, RED, YELLOW)
t2 = Table(data, row_labels=rows, col_labels=cols)
t2.set_column_colors(BLUE, RED, YELLOW, GREEN)
t3 = Table(data, row_labels=rows, col_labels=cols)
r = t3.get_rows()
self.play(*[FadeIn(_o) for _o in [SurroundingRectangle(r[1])]], run_time=1.0)
t4 = Table(data, row_labels=rows, col_labels=cols)
c = t4.get_columns()
self.play(*[FadeIn(_o) for _o in [SurroundingRectangle(c[1]), SurroundingRectangle(c[min(3, len(c) - 1)])]], run_time=1.0)
g = Group(t1, t2, t3, t4).arrange(DOWN, buff=0.35)
g.scale(min(1.0, 12.0 / max(g.width, 0.001), 6.5 / max(g.height, 0.001)))
self.play(*[FadeIn(_o) for _o in [g]], run_time=1.0)
self.play(FadeIn(g))
self.wait(0.5)
self.wait(1.10)
|
下载 Python 脚本
3.7. 单元格操作
单元格操作是比行列操作更加细致表格操作。
1
2
3
4
5
6
7
8
9
10
11
12
13
14
15
16
17
18
19
20
21
22
23
24
25
26
27
28
29
30
31
32
33
34
| from manim import *
import numpy as np
from numpy import array
run_time = 1
def dot(pos, **kwargs):
return Dot(pos, **kwargs)
data = [
["90", "100", "60"],
["66", "78", "83"],
]
cols = [Text("小红"), Text("小华"), Text("小明")]
rows = [Text("语文"), Text("数学")]
class T041_07(Scene):
def construct(self):
sc = self
cols = [Text('小红'), Text('小华'), Text('小明')]
rows = [Text('语文'), Text('数学')]
t = Table(data, include_outer_lines=True, row_labels=rows, col_labels=cols)
cell1 = t.get_cell(pos=(2, 2))
cell2 = t.get_cell(pos=(3, 4))
cell1.set_color(RED)
cell2.set_color(BLUE)
self.play(*[FadeIn(_o) for _o in [cell1, cell2]], run_time=1.0)
t = Table(data, include_outer_lines=True, row_labels=rows, col_labels=cols)
self.play(Create(t), run_time=run_time)
t.add_highlighted_cell(pos=(2, 2), color=GREEN)
t.add_highlighted_cell(pos=(3, 4), color=YELLOW)
objs = [t, t]
g = Group(*objs).arrange(DOWN, buff=0.5)
if g.width > 12: g.scale(12.0 / g.width)
self.play(*[FadeIn(_o) for _o in [g]], run_time=1.0)
self.play(FadeIn(g))
self.wait(0.5)
self.wait(1.10)
|
下载 Python 脚本
3.8. 边框操作
最后,还可以对表格的边框进行定制,get_horizontal_lines和get_vertical_lines方法为我们提供了获取表格横线和纵线对象的方法。
1
2
3
4
5
6
7
8
9
10
11
12
13
14
15
16
17
18
19
20
21
22
23
24
25
26
27
28
| from manim import *
import numpy as np
from numpy import array
run_time = 1
def dot(pos, **kwargs):
return Dot(pos, **kwargs)
data = [
["90", "100", "60"],
["66", "78", "83"],
]
cols = [Text("小红"), Text("小华"), Text("小明")]
rows = [Text("语文"), Text("数学")]
class T041_08(Scene):
def construct(self):
sc = self
cols = [Text('小红'), Text('小华'), Text('小明')]
rows = [Text('语文'), Text('数学')]
t = Table(data, row_labels=rows, col_labels=cols)
lines = t.get_horizontal_lines()
t = Table(data, row_labels=rows, col_labels=cols)
lines = t.get_vertical_lines()
objs = [t, lines[0].set_color(RED), lines[1].set_color(BLUE), t, lines[0].set_color(RED), lines[1].set_color(BLUE), lines[2].set_color(YELLOW)]
g = VGroup(*objs).arrange(DOWN, buff=0.5)
if g.width > 12: g.scale(12.0 / g.width)
self.play(*[FadeIn(_o) for _o in [g]], run_time=1.0)
self.play(FadeIn(g))
self.wait(0.5)
self.wait(3.10)
|
下载 Python 脚本
4. 附件

主观感受,仅供参考。本文采用 本文采用 CC BY-NC-SA 4.0 许可 协议,
完整转载请注明来自
数学动画引擎。