在数学可视化领域,参数方程提供了一种灵活描述曲线的方式。
Manim库中的ParametricFunction类正是为此而生,它允许用户通过参数方程创建各种复杂的二维和三维曲线。
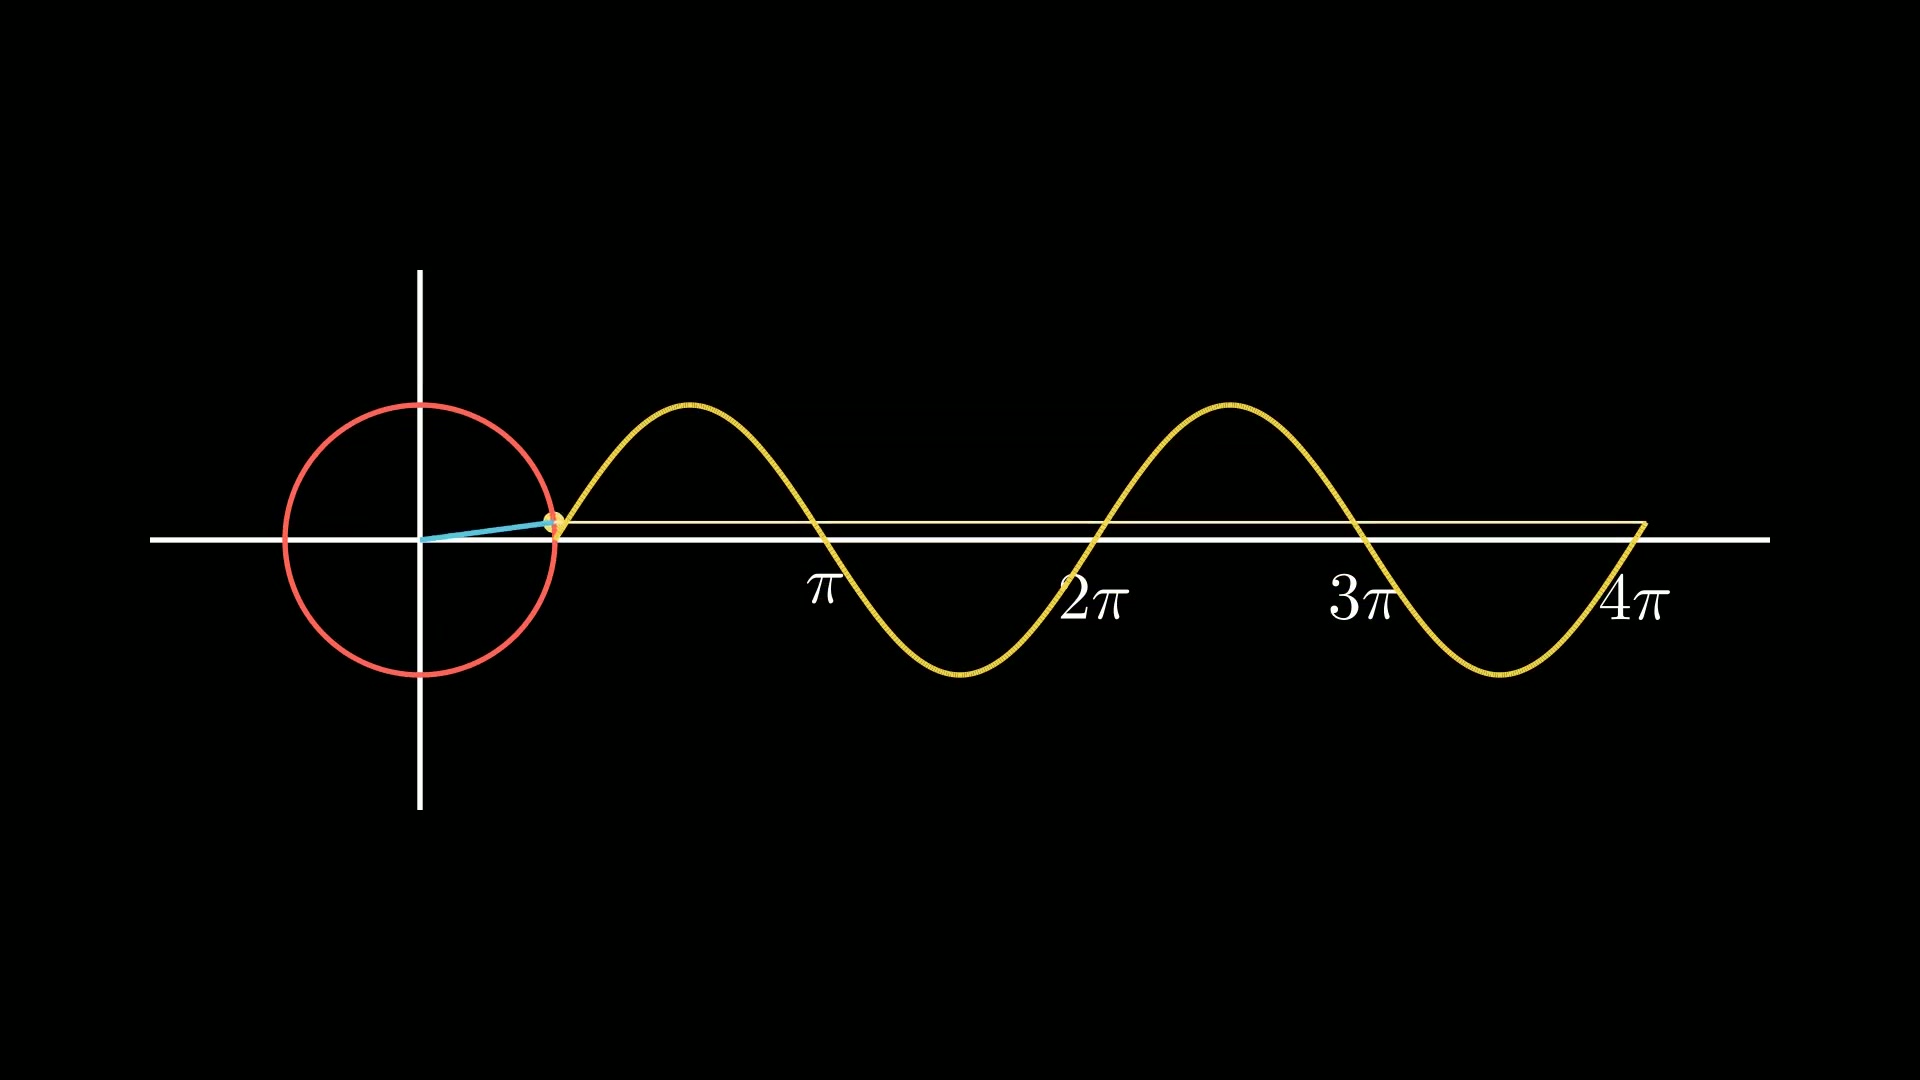
ParametricFunction的核心作用是将数学参数方程转换为可视化的曲线。与普通函数不同,参数方程使用独立参数t表示曲线上点的坐标:
1
2
3
4
| from manim import *
x = f(t)
y = g(t)
z = h(t)
|
其典型应用场景包括:
- 绘制无法用 y=f(x) 显式表示的曲线(如圆、椭圆)
- 创建随时间变化的动态轨迹
- 可视化三维空间曲线(如螺旋线)
- 实现复杂的几何图案(如心形线、星形线)
本文将详细介绍ParametricFunction的作用、主要参数和方法,并通过动画示例来展示其强大的功能。
1. 主要参数
ParametricFunction主要参数有:
| 参数 |
类型 |
说明 |
默认值 |
function |
Callable |
参数方程函数,接收t返回[x,y,z] |
必填 |
t_range |
Sequence[float] |
参数范围[start, end, step] |
[0,1,0.1] |
dt |
float |
计算导数的微小增量 |
0.01 |
use_smoothing |
bool |
是否使用平滑算法 |
True |
discontinuities |
list[float] |
函数不连续点列表 |
None |
color |
颜色常量 |
曲线颜色 |
WHITE |
stroke_width |
float |
线宽 |
2.0 |
其中function参数是一个可调用的函数,形式为(lambda t: (x(t), y(t), z(t)))。
它定义了曲线的参数化形式,t是参数,x(t)、y(t)和z(t)分别是x、y和z坐标随参数t的变化函数。
2. 主要方法
ParametricFunction主要方法包括:
| 名称 |
说明 |
| get_point_from_function |
获取参数t对应的曲线点坐标 |
| get_function |
返回参数方程函数 |
| get_t_range |
返回参数范围 |
3. 使用示例
下面通过几个典型的例子来演示如何使用ParametricFunction类。
3.1. 三维螺旋线
这个示例通过引入z轴参数,我们创建了一个优美的三维螺旋结构,展示ParametricFunction处理3D曲线的能力。
1
2
3
4
5
6
7
8
9
10
11
12
13
14
15
16
17
18
19
20
21
22
| from manim import *
import numpy as np
def head(cn, en):
t = Text(cn, font="STLiti", font_size=27).to_edge(UP)
s = Text(en, font="Consolas", font_size=20, color=YELLOW).next_to(t, DOWN, buff=0.10)
return VGroup(t, s)
def foot(cn):
return Text(cn, font="STLiti", font_size=20, color=YELLOW).to_edge(DOWN)
class ParametricBasic(Scene):
def construct(self):
self.add(head("参数方程绘制圆与椭圆", "ParametricFunction"))
axes = Axes(x_range=[-3, 3, 1], y_range=[-3, 3, 1], x_length=7, y_length=5.4,
axis_config={"color": GREY_B})
circ = ParametricFunction(lambda t: np.array([np.cos(t), np.sin(t), 0]),
t_range=[0, TAU, 0.02], color=BLUE).set_stroke(width=6)
ell = ParametricFunction(lambda t: np.array([2 * np.cos(t), 1.1 * np.sin(t), 0]),
t_range=[0, TAU, 0.02], color=YELLOW).set_stroke(width=6)
self.add(axes)
self.play(Create(circ), run_time=2.2)
self.play(Transform(circ, ell), run_time=2.2)
self.play(FadeIn(foot("x=f(t), y=g(t):同一曲线换参数即换形状")), run_time=0.4)
self.wait(1.8)
|
下载 Python 脚本
3.2. 处理不连续函数
这个示例展示了如何处理不连续函数。
通过指定discontinuities参数,可以正确地绘制不连续函数的图形,这对于展示数学函数的不连续点非常有用。
1
2
3
4
5
6
7
8
9
10
11
12
13
14
15
16
17
18
19
20
21
22
23
| from manim import *
import numpy as np
def head(cn, en):
t = Text(cn, font="STLiti", font_size=27).to_edge(UP)
s = Text(en, font="Consolas", font_size=20, color=YELLOW).next_to(t, DOWN, buff=0.10)
return VGroup(t, s)
def foot(cn):
return Text(cn, font="STLiti", font_size=20, color=YELLOW).to_edge(DOWN)
class Parametric3D(ThreeDScene):
def construct(self):
self.set_camera_orientation(phi=78 * DEGREES, theta=-60 * DEGREES)
self.add_fixed_in_frame_mobjects(head("三维参数曲线:螺旋线", "ParametricFunction / ThreeDAxes"))
axes = ThreeDAxes(x_length=6, y_length=5, z_length=5)
spiral = ParametricFunction(
lambda u: np.array([1.2 * np.cos(u), 1.2 * np.sin(u), u * 0.16]),
t_range=[-3 * TAU, 3 * TAU, 0.02], color=RED).set_stroke(width=5)
self.add(axes)
self.play(Create(spiral), run_time=3.4)
self.begin_ambient_camera_rotation(rate=0.18)
self.wait(2.0)
self.stop_ambient_camera_rotation()
self.add_fixed_in_frame_mobjects(foot("z 随参数线性增长,得到均匀上升的螺旋"))
self.wait(1.4)
|
下载 Python 脚本
3.3. 跳动的心形线
这个浪漫的示例展示了如何创建复杂的心形图案,并通过缩放动画赋予其**“跳动”**效果。
1
2
3
4
5
6
7
8
9
10
11
12
13
14
15
16
17
18
19
20
| from manim import *
import numpy as np
def head(cn, en):
t = Text(cn, font="STLiti", font_size=27).to_edge(UP)
s = Text(en, font="Consolas", font_size=20, color=YELLOW).next_to(t, DOWN, buff=0.10)
return VGroup(t, s)
def foot(cn):
return Text(cn, font="STLiti", font_size=20, color=YELLOW).to_edge(DOWN)
class ParametricHeart(Scene):
def construct(self):
self.add(head("参数曲线:心形线", "ParametricFunction / t_range"))
heart = ParametricFunction(
lambda t: np.array([16 * np.sin(t)**3,
13 * np.cos(t) - 5 * np.cos(2*t) - 2 * np.cos(3*t) - np.cos(4*t), 0]),
t_range=[0, TAU, 0.005], color=PINK)
heart.set_stroke(PINK, width=6).scale(0.16).shift(DOWN * 0.3)
self.play(Create(heart), run_time=3.4)
self.play(heart.animate.set_fill(RED, opacity=0.4).set_stroke(RED, width=8), run_time=1.2)
self.play(FadeIn(foot("缩放 t_range 外的幅值即可控制图形整体大小")), run_time=0.4)
self.wait(1.6)
|
下载 Python 脚本
4. 附件

主观感受,仅供参考。本文采用 本文采用 CC BY-NC-SA 4.0 许可 协议,
完整转载请注明来自
数学动画引擎。